Battery consumption is one of the top areas where we’ve heard that Tailscale needs to improve, via both GitHub and social media. There’s always been work on battery-related issues, but it’s not something that can ever be declared “done”, for a few reasons:
- Tailscale’s feature set evolves — changes like MagicDNS being generally available or the launch of our NextDNS integration means that Tailscale is now more likely to be responsible for all DNS requests issued by a device.
- The operating system changes, and Apple or Google may intentionally or unintentionally change how the application operates, when it’s allowed to run, and how much power it consumes.
- New patterns of user behavior may arise. For example the increased interest in home automation may result in more users wanting to access a hub remotely from a mobile device.
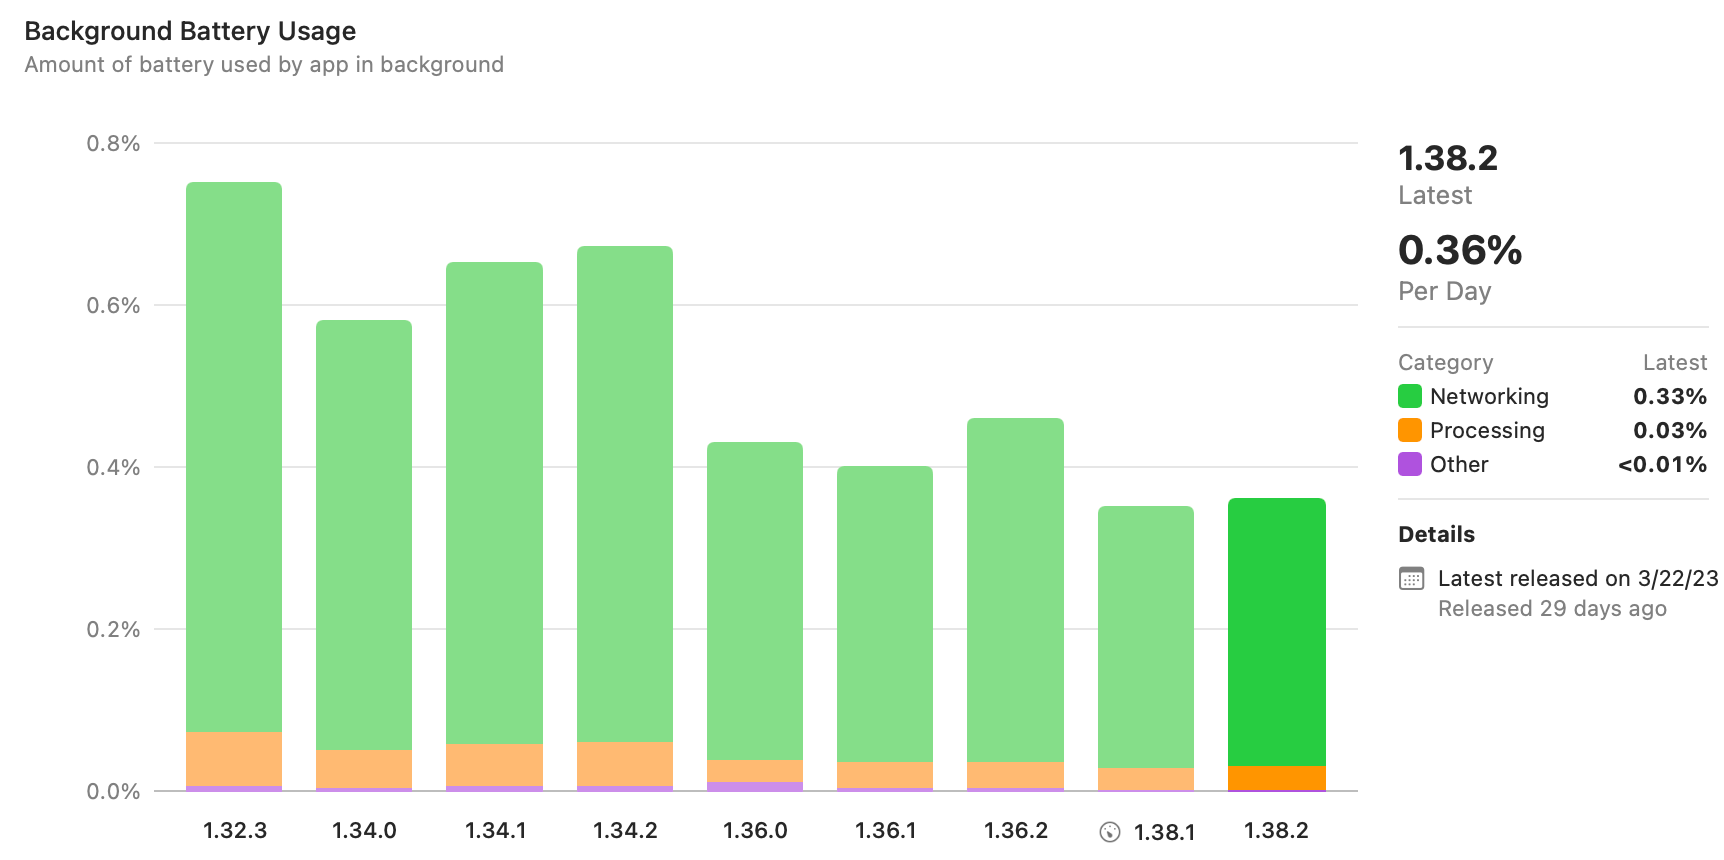
One of the challenges in this work is that it’s hard to get aggregated and actionable data. It’s great that recent versions of iOS and Xcode will collect and aggregate metrics about battery use, but the numbers are delayed and very coarse-grained. When checking these metrics recently, we had the pleasant surprise that Tailscale v1.36 showed a marked improvement compared to v1.34 (see the graph below). But the numbers are so high-level that it's not it’s not clear why they changed — perhaps it was due to the interface binding changes that went into v1.36, or perhaps it was something else. If the direction had been reversed, we would be hard-pressed to know where to begin investigating.
On the opposite end of the aggregation spectrum, we also receive user reports based on-device statistics. While we’re able to correlate observed behavior with a specific user’s tailnet configuration, there's little we can do from just a screenshot of the “Battery” pane of the iOS Settings app. To get more fine-grained data, we’ve been inspired by Saagar Jha’s Effective Power tool to build some better visualizations for on-device power logs, an example of which you can see below:
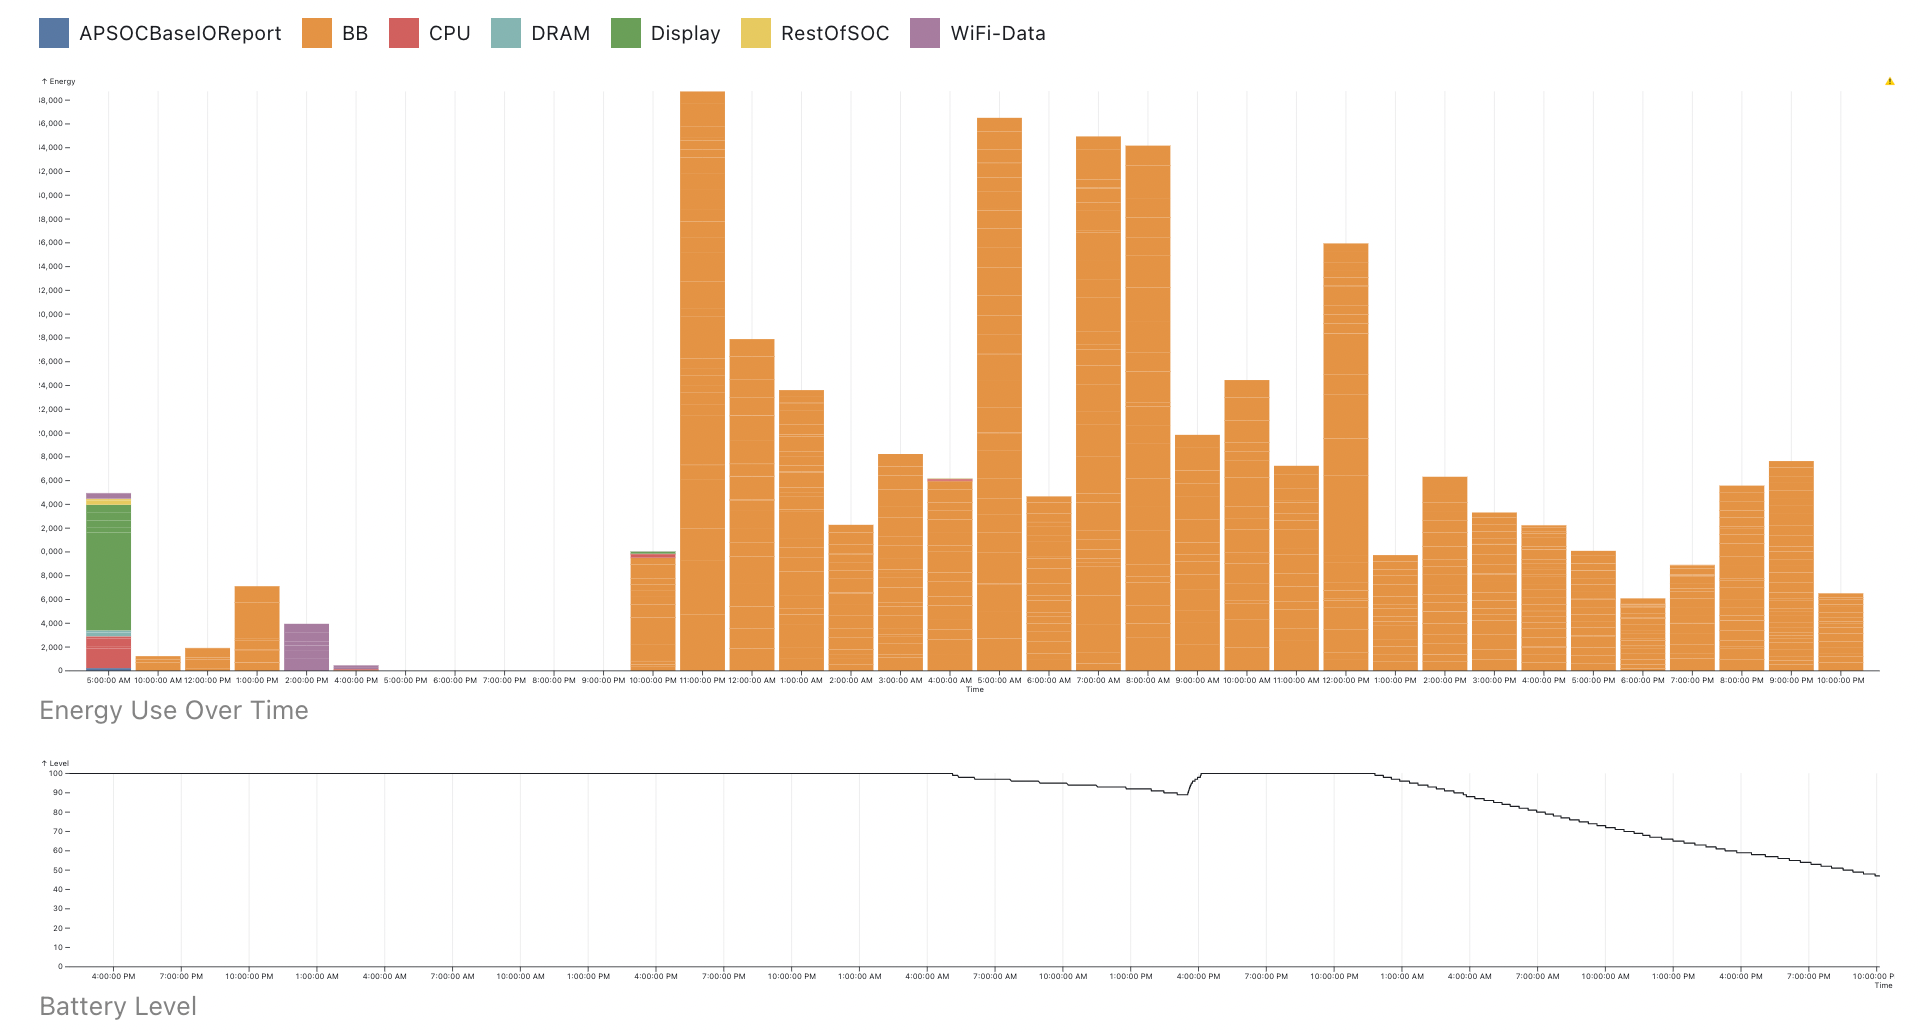
This is a bit better, but the process of getting power logs is still rather complex. The logs are also rather generic — they don’t differentiate between Tailscale’s data and control plane traffic (or any other source of network traffic). At the same time, they’re sensitive — they contain pretty detailed information about all of the apps on the user’s device, even though we just want to know about our own use. We have to be careful how we request and handle them.
To get a handle on this situation, we can make some simplifying assumptions. As seen in the graphs above (“BB” in power logs refers to baseband radio), the main contributor to Tailscale’s battery use is how often it uses a phone’s cellular connection. While there is some CPU overhead from WireGuard encryption and checksumming, it has not been a significant factor in mobile usage. Therefore we can use network traffic as a proxy for overall battery use. Specifically, we want to know how often we’re keeping the cellular radio in a high-power state — there’s a big difference between sending 1,000 bytes in one go, or in 1,000 1-byte packets, one every second (for a total of 16 minutes).
The problem thus becomes “how do we measure our own network use?” We first attempted to go Darwin spelunking — hoping that the network statistics that the OS keeps would allow us to get this information in a low-overhead way. However, the APIs we wanted were either not available on all the platforms we wanted, or were too coarse-grained (without knowing which connection they’re tracking, we can’t distinguish between different kinds of traffic).
We instead turned to one of the quirks of Tailscale that has worked to our advantage in the past — we maintain a lightweight fork of Go. We can thus add some extra probes to the net package that allow us to know when reads or writes happen on a socket. The Go changes are intentionally minimal (just a httptrace-inspired set of callbacks associated with a context) so that they are not a burden to maintain:
ctx = net.WithSockTrace(ctx, &net.SockTrace{ DidRead: func(n int) { // n bytes were read from a socket }, DidWrite: func(n int) { // n bytes were written to a socket },})
All of the Tailscale-specific code (e.g. distinguishing between kinds of traffic) is wrapped in a package that lives in the Tailscale client code, and thus is easier to change at will and create higher-level abstractions:
// Track DNS-over-HTTPS-related network operations.ctx = sockstats.WithSockStats(ctx, sockstats.LabelDNSForwarderDoH)
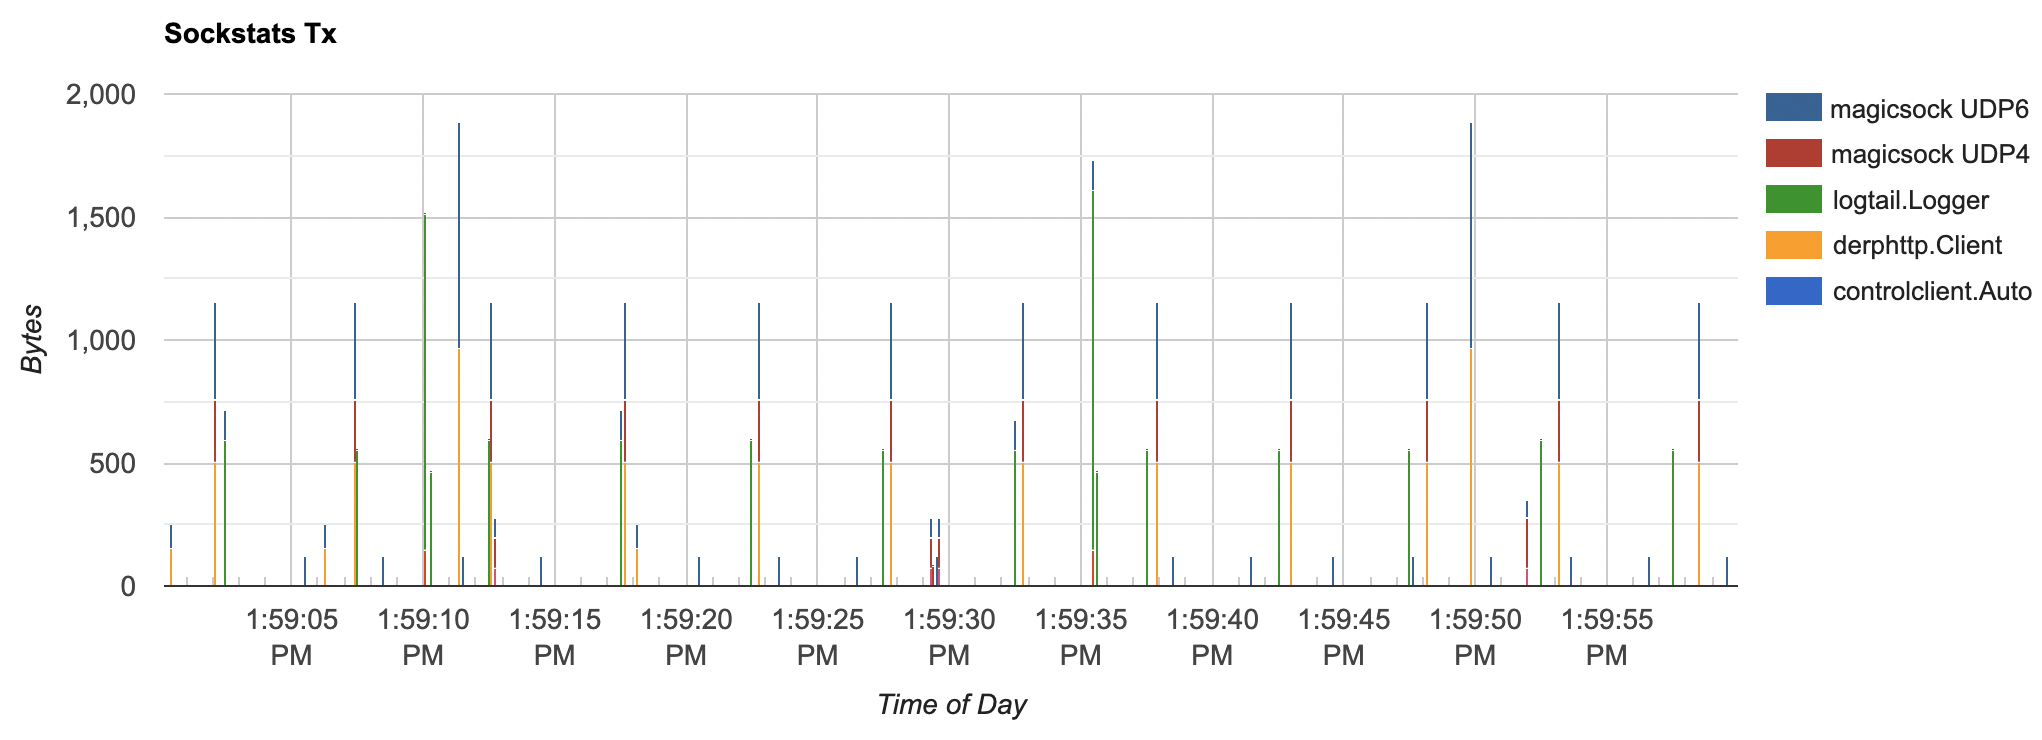
With this in place, we were able to instrument all of the major code paths that trigger network traffic in the Tailscale mobile app:
- Data plane: direct IPv4/IPv6 and DERP-relayed traffic between nodes
- Control plane: communication with the coordination server
- DNS: both UDP and DNS-over-HTTPS
- Port-mapping: probes done as part of NAT traversal
- Logging: diagnostics and metrics uploaded by the client
This instrumentation allows us to do two things:
- Derive the cellular radio power state: while it’s a very simple model (assuming a 3G radio and that Tailscale is the only thing generating traffic), it allows us to have a single number that we can aggregate easily.
- Logging: we can keep track of the type of network traffic done by a client with high-precision. These logs are somewhat expensive to maintain and upload, thus it’s only done for a subset of users. They also very detailed, thus building visualization tooling is key.
With this instrumentation in place, we can have a workflow for tackling battery life investigations:
- Collect high-level aggregated statistics (e.g. the fraction of time spent in high-power states), broken down by Tailscale version.
- If a new version or cohort of clients shows a significant change, pick representative clients and look at their network usage.
- Based on the observations, make changes to the clients (or possibly change the instrumentation).
- Deploy changes, and see if they have the desired effect.
All of this instrumentation has landed relatively recently, but we’ve already been able to use it to identify and begin investigating some issues.
If you keep sending packets every 5 seconds, you’re going to have a bad time
Tech industry blog posts stereotypically end with “We rewrote our app in language X/ported it to framework Y/adopted methodology Z and all our problems were solved!”, but this is not one of them. It would be nice if all this work would lead us to a single root cause that would let us say “Tailscale’s impact on battery life is negligible now.” Based on our experience thus far, the much more likely outcome is that there will be many small issues or unexpected interactions between sub-systems that lead to excessive battery use. It’s also likely that we’ll need to improve our tooling as we discover new things.
We’ve now established the infrastructure to be able to investigate battery life issues more easily, as well as keep an eye out for any regressions. The hope now is that we'll be able to see noticeable improvements as we tackle these issues.